In this short series on strategy we are uncovering four hygiene conditions that need to be in place for a successful strategy. As said before: There are no guarantees in strategy.
The four hygiene conditions of strategy are:
- A CLEAR, CONSISTENT, LONG TERM OBJECTIVE,
- A PROFOUND UNDERSTANDING OF the COMPETITIVE ENVIRONMENT,
- AN OBJECTIVE APPRAISAL OF THE RESOURCE BASE, AND
- AN EFFECTIVE IMPLEMENTATION.
In this post we will focus on the second condition: A PROFOUND UNDERSTANDING OF the COMPETITIVE ENVIRONMENT.
The competitive environment of any company or organisation consists out of a “red ocean” of bloody contested marketing space filled with fighting competitors and the potential of a “blue ocean” of uncontested market space where competition is (still) irrelevant. The type of understanding, which recognises the changing structures generating both these oceans is the profound understanding we’re looking for.
The tricky thing is that once we fully understand the red ocean market space it typically becomes harder to see any potential blue oceans. However, we have to take this risk because not understanding the current situation will make us naive, or worse, ignorant.
The standard approach in understanding the attractiveness of a market space – or industry – is Michael Porter’s five forces model dating back to 1979. The premise is that if you are able to understand the structure of an industry as determined by five competitive forces, you will then be able to explain the level of competitiveness and the subsequent average profitability within this industry.

Industry Structures range from the dark red ocean “perfect competition” where there are no frictions (perfect information, zero transaction costs and property rights, etc.) to deep blue ocean “monopoly” where the entrepreneur fully thrives on the market “imperfections” for the purpose of cost minimalisation, value creation and value capture.
Porter’s five forces should by no means be your only tool, but particularly if you include structural dynamics over time it provides a good start towards the profound understanding we are looking for.
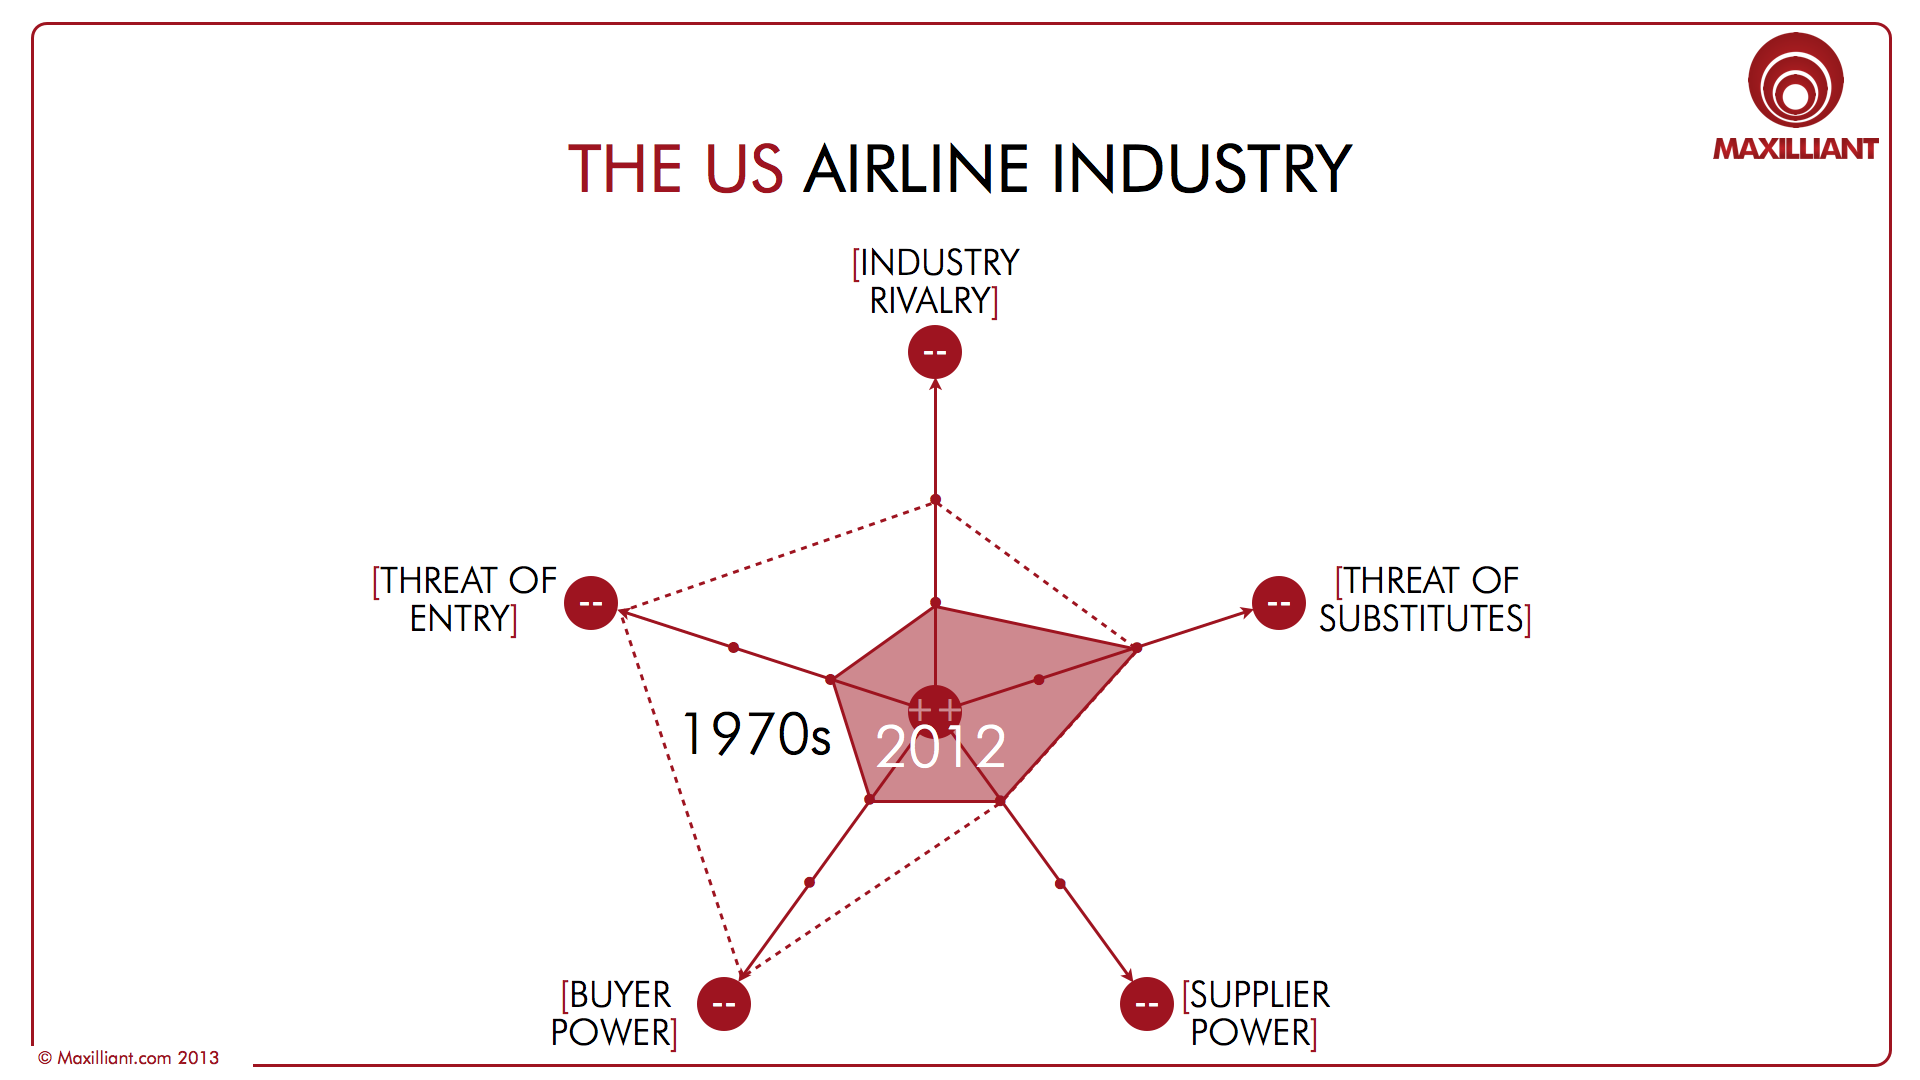
As an example let’s have a quick look at the US airline industry – traditionally the least attractive industry with a profitability of minus 11.3% between 2000 and 2010. We will contrast the industry structure prior to deregulation (pre-1978) and 2012.
- The first competitive force we will assess is the threat of substitutes. The availability of substitutes to flying implies that customers are able to switch in response to price increases. More viable substitutes means lower profitability. Between 1978 and now how would you rank the threat of substitutes in the US airline industry? Based on the availability of close substitutes, the price/performance ratio of these substitutes and the customers’ propensity to switch you can score this force between a very low threat, a low threat, a high threat, or a very high threat. In the US airline industry the threat of substitutes is relatively low – you can use trains instead of some short haul flights in the east, but overall this is not a substantial threat. The threat of substitutes has not really changed much over the last 30 years.
- The second competitive force is the relative bargaining power and price sensitivity of your suppliers. Many small suppliers, with low switching costs, and whose product plays a minor role in our product while we are highly informed about all offerings, leads to very low supplier power. A few large firms, with high switching cost, whose product plays a vital role in our product while we are not well informed about offerings leads to very high supplier power. In the US airline industry there are few suppliers (there are basically only two aircraft suppliers and there is a strong union) and their “products” play a vital role while there are high switching costs. This leads to high supplier power and this has not really changed over the years (although union power has reduced).
- The third competitive force is the relative bargaining power and price sensitivity of buyers. Many small, ignorant buyers for whom the product plays a vital role and for which there are high switching costs leads to very low buyer power. This was the situation in the 1970s in the US airline industry. A few large and/or many well-informed buyers for whom the product plays a minor role with no switching cost have lots of power. Today in the US airline industry the power of buyers is high and this has been facilitated by the power of the Internet.
- The forth competitive force is the threat new competitors can and/or will enter your market. High capital requirements, scope and experience advantages, barriers to access distribution channels and legal restraints leads to a very low threat of entry. In the 1970s entry into the US airline industry was prohibited. However, low capital requirements, no scope or experience advantages, full distribution access, and no legal restraints leads to a very high threat of entry. Today in the US airline industry capital requirements are low (i.e. leasing aircrafts) but complexity is high and distribution access not always easy (airports). In spite of the latter the threat of new competitors is still high.
- The fifth competitive force is in many ways the sum of the former forces: the level of competitive rivalry in the market. A few large similar firms (or one), differentiated offerings, and/or under-capacity and/or no exit barrier leads to very low rivalry. Many small firms, very similar offerings, diverse competitors, excess capacity, and high exit barriers leads to very high rivalry. In the 1970s in the US airline industry competitiveness was regulated and as such quite low. Today there is a growing concentration among the biggest 4 competitors, but there are also a large number of smaller players. The value propositions are less and less differentiated, there is excess capacity although it is lower than it used to be, and for the larger players there are high exit barriers. This leads to high rivalry. If we put the 1970s and the 2012 industry structure in a graph it would look like this (see figure). Interestingly the larger the area, the larger the profitability of the industry: This is the economists’ logic: industry structure determines competitive behavior which determines profitability.
However, this logic is not – or is no longer – a one-way-street. It is the quest for profitability or blue oceans which drives some companies to search for or to define uncontested market spaces where competition is (still) irrelevant (i.e. changing the industry structure).
When you are active in a dark red ocean market the rules of survival are fairly strict and ignoring these is a sure way into receivership. That is why you use an outside-in approach determining what the structure and the competitiveness is so that you can then determine what your strategy should be. The search for blue ocean is contrary to a red ocean one: an inside-out approach where you first need to know what you have in terms of resources and what you can build or do with these to distinguish your offering from the competition. Interestingly, this points an objective appraisal of your resource base, which is the third hygiene factor to be discussed in the next installment.

3 thoughts on “Strategy Hygiene Conditions – Part 2: A Profound Understanding of the Competitive Environment”